Dr David C. Wilson
Independent Resource and Waste Management Consultant Visiting Professor in Resource and Waste Management at Imperial College London
David C. Wilson has been an international waste and resource management consultant since the 1970s, and a Visiting Professor at Imperial College London since 2000. He is a prolific author on waste and resource policy, strategy and evidence, and a five-time winner of the prestigious annual ISWA Publication Award.
Professor Wilson is an active member of the expert group in ISWA’s Plastic Treaty Task Force.
1. Much of the focus of negotiations on an international legally binding instrument on plastic pollution (the ‘plastics treaty’) is rightly on plastics reduction and circularity. But a necessary parallel component is sound waste management and leakage prevention. Of course the long term goal is the 3Rs of reduce, reuse and recycle, restricting the need for sound management to a small fraction of residual plastics waste. But to buy time to implement that, an early priority must be to stem the current catastrophic flow of plastics into the environment and the oceans.
Inadequate waste management as the key source of plastic leakage to the environment
2. One of the better current sources of data on plastic flows through the full lifecycle was published by OECD in March 2022 [2]. 464 million metric tonnes (MMt) plastics were produced in 2019, with 353 MMt of waste generated. Inadequate end-of-life waste management resulted in an estimated 22 MMt of plastic wastes leaking into the environment in 2019; this was split into 12% microplastics, 1% from marine activities, 5% from littering and 82% from inadequate waste collection and disposal. How much unmanaged or mismanaged plastic waste reaches the oceans? OECD provides an estimate of 6.1 MMt for 2019[3], which is likely more reliable than earlier, but still often repeated, estimates of 8 MMt from cities near the coast[4] plus 2 MMt via rivers from further inland[5], i.e. 10 MMt per annum.
3. It follows that there are two parallel objectives for the plastics treaty. First, to ‘turn off the tap’, to slash both plastics production and the 353 MMt per annum of plastics waste generation, which requires the focus on reduction and circularity. Second, to cut off at source the 22 MMt per annum overflow to the environment and the oceans. As the OECD report states: ‘This (latter) problem is becoming worse as leakage from mismanaged waste has doubled since 2000. The numbers stress the urgency of addressing waste management practices in rapidly developing economies’[6]. Thay advocate an early focus on basic, relatively unambitious, policies to close leakage pathways through investing in collection and disposal infrastructure (Figure 1).
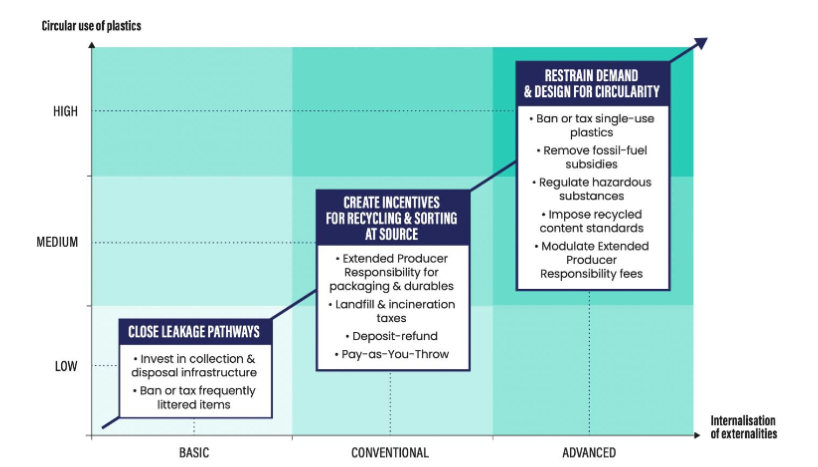
Figure 1
OECD’s policy roadmap for more circular plastics involving a stepped approach[7]
4. The purpose of this note is to reinforce those recommendations, which unfortunately are NOT reflected in current preparations for the plastics treaty. Waste management appears to be getting squeezed into the background, instead of being a key part of the main agenda.
5. One example is in the seminal UNEP 2023 report ‘Turning off the Tap’[8], which proposes an ambitious systems change scenario as a solution to the plastics crisis. Table 3 sets out resulting outcomes and scale of change in the next 5 years and by 2040. Management of currently arising wastes has been ‘relegated’ under the rather misleading sub-heading ‘Dealing with the Legacy’, which has five components: microplastics, adding annual controlled disposal capacity, reducing leakage to the environment, reducing mismanaged waste globally, and reducing exports to countries with low collection and high leakage rates. But under the later Chapter 3 on ‘Dealing with the Legacy’, just three of those are expanded on, with the two italicised topics relating to leakage and mismanaged waste being omitted.
6. Extending municipal solid waste collection to all is key to reducing leakage; it is symptomatic that the term ‘collection’ is not explicitly defined in the UNEP report, and ‘collection rate’ is used only in the context of collection for recycling[9].
7. To achieve systems change, the targets set for 2028 and 2040[10] need to be ambitious. That is however not the case for stemming leakage of plastic to the environment, where reductions of 3.5 MMt by 2028 and 7 MMt by 2040 are very modest given the 2019 baseline of 19.4 MMt[11]. Nor for mismanaged waste, where targets to reduce the 40% in 2016 to 27 % in 2028 and 10% in 2040 compare unfavourably in terms of ambition to the original 2015 SDG target 12.4 ‘by 2020 achieve environmentally sound management of … all wastes throughout their life cycle’[12].
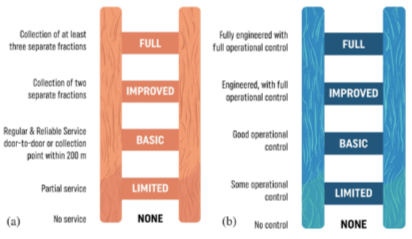
Figure 2[15]
(a) Service ladder for waste collection. (b) Control ladder for recovery and disposal, this example for landfill.
The basic levels must be met to ‘count’ towards indicator SDG 11.6.1.
The full control level corresponds to environmentally sound management (ESM).
8. Waste management is not one of the high level sustainable development goals, rather being dispersed within targets under other SDGs. UNEP and ISWA’s Global Waste Management Outlook (GWMO)[13] assembled five targets within a ‘virtual waste SDG’, disaggregating the target above into three parts: W1, by 2020, ensure access for all to adequate, safe and affordable solid waste collection services; W2, by 2020, eliminate uncontrolled dumping and open burning ; and W3, by 2030, ensure the sustainable and environmentally sound management of all wastes, particularly hazardous wastes. Targets W1 and W2 are monitored globally by the official SDG indicator 11.6.1, the proportion of municipal solid waste (MSW) (a) collected and (b) managed in controlled recovery and disposal facilities, out of total MSW generated in a city. To count towards the indicator, standards must meet at least the intermediate ‘basic’ levels defined in the collection service ladder and recovery and disposal control ladders (Figure 2), in the Waste Wise Cities Tool (WaCT)[14]; full control or environmentally sound management (ESM) is the top step.
9. A recent theory of waste and development outlines nine ‘development bands’ (DBs – Figure 3), with DB1– DB4 showing increasing %s for the two component SDG 11.6.1 indicators, moving towards the new target baseline of DB5 where 95+% compliance is achieved. This target was only reached in high income countries around 1980, with some then progressing quickly towards full control or environmentally sound management (DB6/7), and then later towards higher service levels with collection of several source segregated fractions to facilitate recycling (DB8/9)[16]. Progress in developing countries has been much slower, although many cities and countries are now making substantial progress on SDG 11.6.1. Recent estimates are that 7 billion people worldwide still lack access to municipal solid waste collection, and 40% of collected waste goes to uncontrolled disposal or open burning – which constitutes an on-going global waste emergency[17].
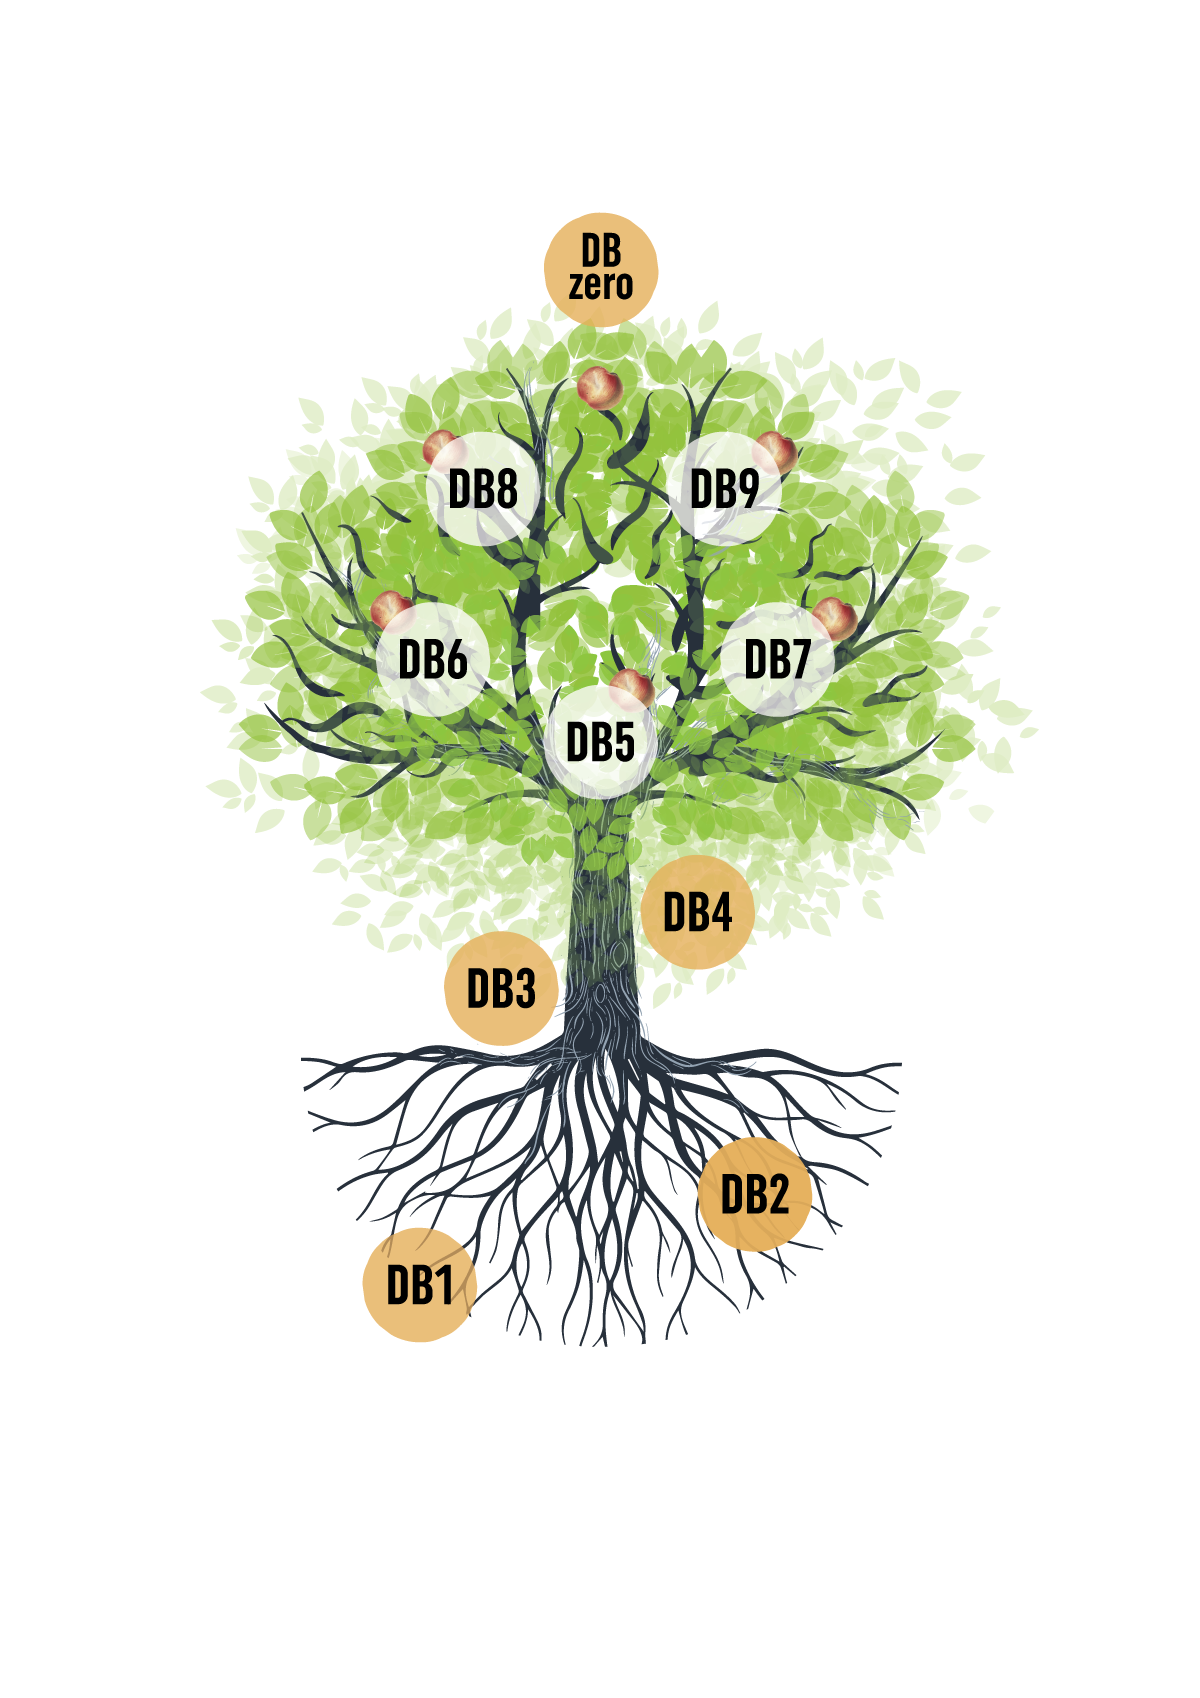
Figure 3 [18]
The Nine Development Bands (9DBs) theory of waste and development: the ‘9DBs tree’ and the key to the DBs
DB5: basic level of collection and controlled recovery and disposal (95+% on both SDG 11.6.1 indicators)
DB6/7: full control/ environmentally sound management (ESM)
DB8/9: full collection service level (segregated collection)
10. How far would extending municipal solid waste collection to all and phasing out uncontrolled dumping and burning cut the leakage of plastics waste to the environment and to the oceans? As noted above, OECD singled out such unmanaged and mismanaged wastes as the primary cause of 82% of all plastic waste leakage to the environment; and noted that some continuing leakage will occur from plastics already in riverbeds [19]. Both of which would support earlier best estimates that reducing the source term in this way would halve the mass of macroplastics reaching the oceans [20], and cut by more than 90% the open burning of plastic wastes.
11. Collecting and controlling municipal solid wastes is a continuing challenge in many developing countries. Achieving the SDG 11.6 target of near universal collection and controlled disposal of municipal solid wastes would cut in half the mass of plastics entering the ocean. So rather than looking at plastics waste management in isolation, the plastics treaty needs to focus on improving the management of all municipal and related solid wastes.
Progress in improving waste management has generally been stepwise
12. One lesson from recent history is that progress in improving waste management is generally stepwise. The 9DBs as shown schematically in Figure 3 describe past journeys, and help in understanding the current starting position and likely key pressure points in any specific country; a key lesson is that ‘no one size fits all’. It is also important to learn from mistakes made in the Global North; in particular, earlier action is necessary to segregate waste at source. This will help to build on existing informal recycling, enabling cleaner working conditions, increased quantity and better quality of materials and improved livelihoods. Integrating informal recycling with the MSWM service will also reduce quantities of residual waste requiring collection and controlled disposal [21].
13. The Zero Draft[iv] plastics treaty prepared for the intergovernmental negotiating committee (INC-3) completely overlooks the fact that all countries have moved stepwise in implementing waste management controls. Both options in the waste management section place obligations on each Party to implement ‘safe and environmentally sound waste management’ at all stages of waste management. Relating this to the 9DBs framework in Figure 3, the target would be to achieve at least DB6/7, with all wastes collected and 95+% recovered or disposed in full control/ environmentally sound management (ESM) facilities.
14. This approach was considered and rejected when SDG indicator 11.6.1 was being developed, in favour of disaggregating the target into three component indicators. The first two, collection coverage and controlled recovery and disposal to meet the ‘basic’ levels defined in the ‘ladders’ (Figure 2), comprise SDG 11.6.1. The third indicator, to monitor progress from ‘basic’ to ‘full’ control or ESM, falls under Target SDG 12.4. This way, countries can be congratulated as they make steady progress on the two SDG 11.6.1 indicators. During this period, performance against the third ESM indicator is likely to be minimal; if this is, say, 10%, then a combined indicator for ‘safe and environmentally sound waste management’ would be less than 10% (obtained by multiplying the three components, e.g. for full SDG 11.6.1 compliance: 0.95 x 0.95 x 0.1 = 0.09). Thus, using only the aggregate target would provide a significant disincentive to progress.
15. Finance has long been recognised as a major constraint to improving municipal solid waste management in developing countries [22]. The costs of basic services to meet SG 11.6.1 are unaffordable in many towns and cities [23]. One issue is that, even in the poorest countries, a major proportion of municipal solid waste is plastic and other packaging – these costs need to be borne by those who make money by placing packaged products on the market, via a well-designed and effective extended producer responsibility (EPR) system. Another issue is that costs pf MSWM are always considered a local responsibility; but the benefits are both local and global, the latter through both significant reductions in plastics reaching the environment and oceans and significant mitigation of climate heating. So, both ‘plastics finance’ and EPR under the new plastics treaty, and climate finance, are key to tackling the financial constraint [24].
16. The zero draft proposes placing all the responsibility for waste management, and of introducing EPR, on each Party (national government). As argued in the previous paragraph, the international community must accept some shared responsibility. It is also completely unrealistic to expect small developing countries whose GDP is less than the turnover of many of the transnational fast moving consumer goods companies (FMCGs) to negotiate individual EPR regimes. Rather, the plastics treaty needs to institute a mechanism for regional or even global negotiation and implementation of proper EPR ‘with teeth’ [25].
Conclusions
17. Extending municipal solid waste collection to all and phasing out uncontrolled dumping and burning is technically feasible. What needs to be done is well known – progress needs to be stepwise – major constraints are lack of political will and mismatch of local costs versus global benefits. This is an essential, practical and cost effective way to stem leakage of plastic wastes to the environment and oceans, capable of significantly faster progress than assumed in the UNEP system change scenario. It would halve plastics leakage at source, providing a ‘low hanging fruit’ which would buy time for the necessary, parallel actions on reduction and circularity. Not only does waste management need to be on the main agenda of the intergovernmental negotiating committee (INC), but the focus needs to be on improving management of all municipal and related solid wastes, rather than attempting to consider plastic wastes in isolation.
[1] www.davidcwilson.com; waste@davidcwilson.com
[2] OECD, 2022. Global Plastics Outlook: Economic Drivers, Environmental Impacts and Policy Options. https://doi.org/10.1787/de747aef-en.
[3] OECD, op. cit., Section 1.3.3, page 21.
[4] Jambeck, J. R., Geyer, R., Wilcox, C. et al., 2015. Plastic waste inputs from land into the ocean. Science, 347(6223), 768–770.
[5] Lebreton, L. C. M., Zwet, J. v. d., Damsteeg, J.-W. et al., 2017. River plastic emissions to the world’s oceans. Nature Communications, Volume 8:15611.
[6] OECD, 2022, op. cit., Section 1.3.2 Mismanaged plastic waste is the main source of macroplastic leakage, page 21.
[7] OECD, 2022, op. cit., Figure 1.4, p 26.
[8] UNEP, 2023. Turning off the Tap – How the world can end plastic pollution and create a circular economy. https://www.unep.org/resources/turning-off-tap-end-plastic-pollution-create-circular-economy.
[9] UNEP, 2023, op. cit.
[10] UNEP, 2023, op. cit., Table 3, pp 16-17.
[11] OECD, 2022, op. cit., pp 21.
[12] UN, 2015. Transforming our World: The 2030 Agenda for Sustainable Development. https://sdgs.un.org/publications/transforming-our-world-2030-agenda-sustainable-development-17981
[13] UNEP and ISWA, 2015. Global Waste Management Outlook (GWMO). Eds: D. C. Wilson & A. Carpintero-Rogero. www.unenvironment.org/resources/report/global-waste-management-outlook.
[14] UN-Habitat, 2021. Waste Wise Cities Tool: Step-by-Step Guide to Assess a City’s MSWM Performance through SDG indicator 11.6.1 Monitoring. Prepared by Takeuchi, N,; Whiteman, A. D.; Zabaletta, I.; and Velis, C. A.(UN Habitat, Wasteaware, EAWAG and University of Leeds) https://unhabitat.org/wwc-tool
[15] Levels in the ladders summarise those in UN-Habitat 2021, op. cit. Ladder figures first published in Whiteman et al. 2021, see next reference. Figures © Andrew Whiteman and David C. Wilson (Graphics: Ecuson Studio). The earlier precursors of the ladders are outlined in Wilson, D. C. 2023, see reference below, Figure 2.
[16] Whiteman, A., Webster, M. & Wilson, D. C., 2021. The nine development bands: A conceptual framework and global theory for waste and development. Waste Management & Research, 39(10), 1218-1236. Open access: doi.org/10.1177/0734242X211035926
[17] Wilson, D.C., 2023. Learning from the past to plan for the future: An historical review of the evolution of waste and resources management 1970-2020 and reflections on priorities 2020-2030 – The perspective of an involved witness. Waste Management & Research, Online First 21 September. Open access: doi.org/10.1177/0734242X231178025
[18] Whiteman et al. 2021, op. cit. Figure © Andrew Whiteman (Graphics: Ecuson Studio).
[19] OECD, 2022, op. cit.
[20] CIWM and Wasteaid UK, 2018. From the Land to the Sea: How better solid waste management can improve the lives of the world’s poorest and halve the quantity of plastic entering the oceans https://learn.wasteaid.org/wp-content/uploads/2018/04/From-the-Land-to-the-Sea.pdf
[21] Wilson, 2023, op. cit.
[22] UNEP, 2023. Zero draft text of the international legally binding instrument on plastic pollution, including in the marine environment. UNEP/PP/INC.3/4, 4 September 2023. https://wedocs.unep.org/handle/20.500.11822/43239
[23] Arlosoroff, S. 1991. Developing countries struggle with waste management policies. Waste Management & Research, 9, 491-4
[24] UNEP and ISWA, 2015, op. cit. GWMO Chapter 5, Waste management financing.
[25] Wilson D.C. 2023, op. cit., Part C, Three key policy priorities.
[26] Wilson D.C. 2023, op. cit., Part C, Extended producer responsibility.

